For me, Microsoft Excel is indispensable. If leveraged properly, its data analysis capabilities help me get the answers I need from my data.
As the Chief Financial Officer at AMG, I need those data-driven answers to forecast cash flow and profitability for the business, track business metrics, and analyze business data to interpret results and improve forecasts.
Below are three essential Excel skill areas I rely on nearly every day. I hope you find them useful for your workflow, too.
Feature 1: CONDITIONAL FORMULAS
Conditional formulas can help you calculate counts, totals, averages, and text string results based on one or more conditions in your data set.
Examples of common tasks where I use conditional formulas include:
- Sales Incentive Calculations
- Income and Cash Flow Projections
- Contract & Sales Analysis
- Commitment and Subcontract Summaries and Analysis
- Budget & Estimate Calculations
If you know what questions you want your data to answer, you can probably write a conditional formula to answer them. Conditional formulas can help you answer the real-world questions you have about your data.
For me, that means questions like:
- How did our revenue stream by product or service look this year?
- What does our sales projection by product line or revenue stream look for the next year?
- What does our monthly cash flow projection look like for the coming year?
- Which suppliers provided the greatest labor cost value for each trade area?
One great thing about conditional formulas is that once you learn how to use just one of the conditional formulas, the syntax for all the conditional formulas is similar. Therefore, if you can sum, then you can count and average easily too.
If you’re already a pro with conditional formulas, then you already know how valuable they are. If you’re not, and want to learn, I highly recommend checking out Chandoo’s Introduction to SUMIFS.
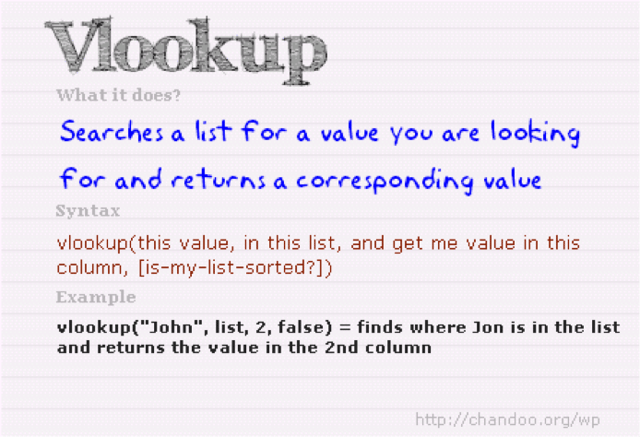
Feature 2: LOOKUP Formulas
Lookup formulas are essential if you want to tie together information from multiple data sets.
For instance, if you have financial information about your project in one dataset and customer information in another, you can use lookup formulas to bring data from both data sets into a combined set.
Here are some ways I use lookup formulas when combining data sets:
- Link a list of projects to a list of customer details (or sales team details, etc.)
- Lookup customer payment terms and tie it to a list of invoices or payment history to help with cash flow forecasts
- Link customer data with sales pipeline data for improved sales forecasts
- Use corporate target codes to lookup financial data and tie to target metrics
- Use in combination with conditional formulas to produce multiple forecasts from a consolidated data set
The key to learning how to use and leverage lookup formulas like VLOOKUP, HLOOKUP, MATCH, & OFFSET is understanding how your data sets are related. You also need to have some basic knowledge of ranges in Excel.
Once again, Chandoo is my go-to source for lookup formulas, and the best part is that most of the information is available for free. Mr. Excel’s YouTube Channel is also a good resource to learn more about Excel lookup formulas.
Feature 3: PIVOT TABLES
The pivot table is a critical tool for organizing and analyzing large data sets.
If the data you are working with starts in a program or any type of information system, then the pivot table can provide a quick, powerful summary with grouping, totaling, and drill-down capabilities.
Pivot tables can be used in conjunction with conditional and lookup formulas, and their capabilities are far beyond what a simple formula can do. Plus, you don’t have to write formulas to get impressive results.
Some of the results I get from pivot tables include:
- Client revenue by state, month, and project with drill-down capabilities at each level
- Project gross margins with breakdown by cost types and suppliers
- Payroll labor cost by employee, project, pay type, and date
- Project commitments versus billed items
- CRM data review and analysis
Pivot tables allow you to manipulate, filter, and summarize the data without changing the original data set. Drill-down capabilities allow you to see more or less detail and you can easily change fields in your rows or columns by dragging and dropping fields from one area of the table to another.
Here is an example of a pivot table produced in five minutes or less from a list of project purchase orders.
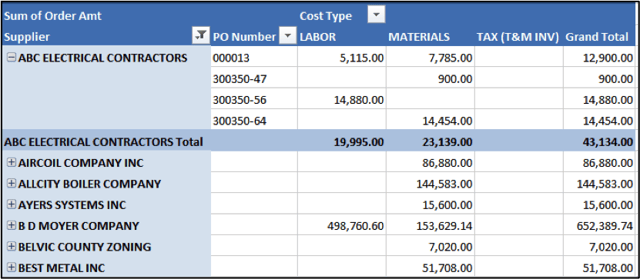
Value data can also be customized to provide the summary that you want. Dollars, percentages, and counts are common value summary options.
Pivot tables provide powerful data analysis capabilities, and if you’re wondering where to start then you probably guessed right – Chandoo.org. Try the Excel Pivot Tables Tutorial: What is a Pivot Table and How to Make One for a quick overview.
Leveraging Excel Features for Maximum Efficiency
If, like me, you work closely with data, you know all too well how simple tasks can sometimes take longer than expected because you cannot seem to get the answers you need from the data. Assuming that you have sufficient data, you may find that you simply need better tools for analyzing the data you have.
If you have not put any of these powerhouse Excel features to the test yet, then don’t wait any longer. Don’t worry about the learning curve because the time-savings are significant and the turn-around is short.